Visualization of Digital Archaeological Collections
 An screenshot of the interactive tool.
Government agencies increasingly share digital data as part of their commitments to Open Government. While well intended, this information is often shared in formats and ways that are not easily understood by non-specialists, Indigenous peoples and members of the general public, nor do they address data governance issues and cultural protocol associated with Indigenous data. Furthermore, communities cannot readily access and use data stored in various repositories for community well-being and decision making about activities that impact the community.
To this end, UBC Okanagan and Open Context have developed an interactive visualization of digital archaeological collections that enable insights into cultural heritage. Interactive visualizations summarize information, and allow navigation of large volumes of data. These tools can implemented and developed for a range of digital archaeological collections.
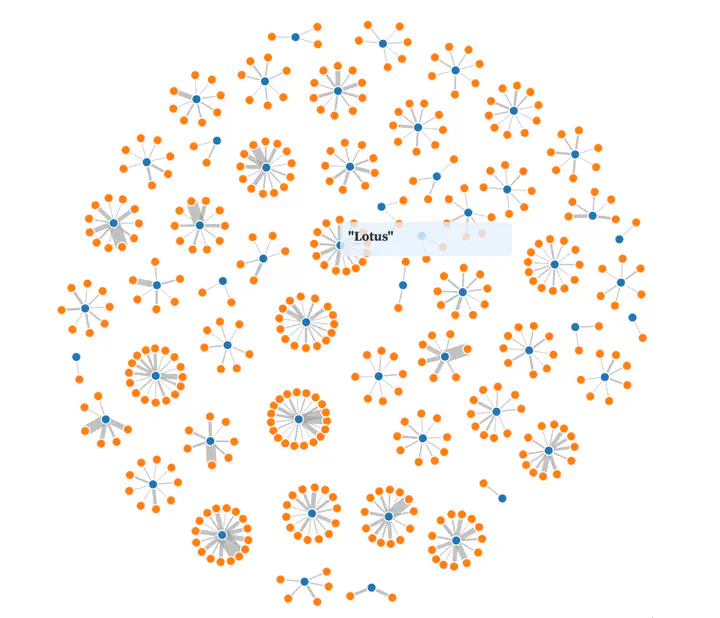
Interact with the visualization. The visualization demonstrates the co-occurrence between motifs and decoration techniques on pottery from the Poggio Civitate digital collection. Orange nodes represent motifs and decorative techniques are blue nodes. Edges or lines connecting nodes represent counts of co-occurrences. The thicker the edges, the greater the number of co-occurrences.
The project was funded by the UBC Okanagan Public Humanities Impact Award.